A colorful illustration of a character named Piko4
Business Analyst Banner
...

COURSE DESCRIPTION

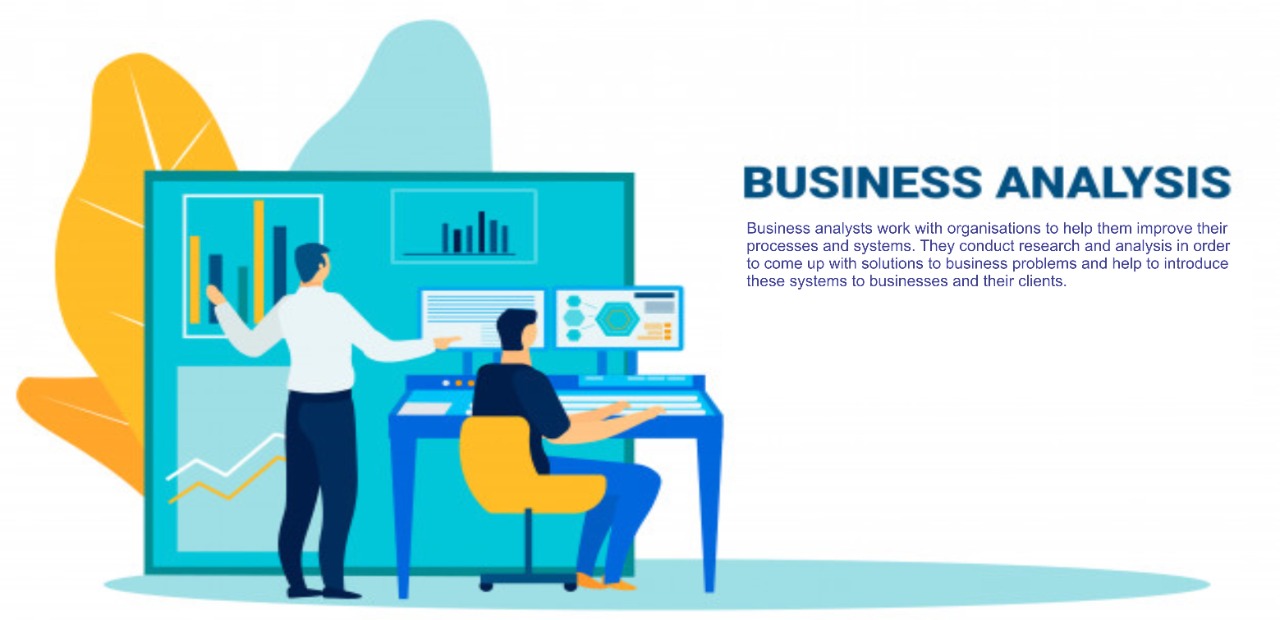
Business analytics encompasses both quantitative and qualitative methodologies aimed at optimising productivity and profitability within organizations. It involves extracting, analysing, and interpreting data, such as behavioural patterns and business trends, to facilitate informed decision-making. Business analytics is essential for enhancing customer satisfaction, improving productivity, and identifying growth opportunities.

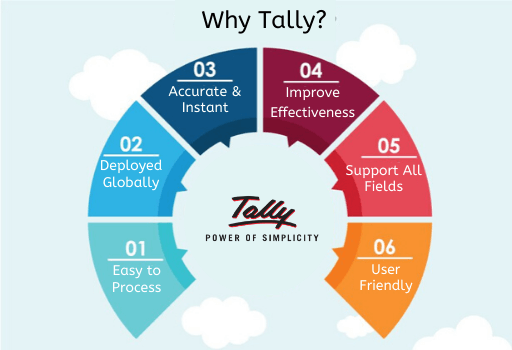
The latest iteration of the Tally Prime Accounting Software introduces a seamless GST setup, ensuring prompt and accurate tax calculations. This feature-rich software supports all essential GST transactions for businesses. Our Tally Prime Training Course with GST offers a comprehensive understanding of industry-specific accounting requirements, providing both conceptual knowledge and hands-on experience in day-to-day accounting processes.

As an integral component of organisational functioning, business analytics requires proficiency in data recording, analysis, and presentation to support effective decision-making by management. Mastery of various business analytics tools, including Python, R-Programming, MS Excel, Access, Visual Basic for Applications (VBA/Macros), SQL, Tableau, and business intelligence tools, is imperative for professionals in this domain.

To develop expertise in business intelligence and data analytics tools, enrolling in a high-quality business analyst training course in Delhi is recommended. Our institution offers the best business analyst course in Delhi, providing comprehensive training in various business analytics techniques and tools. Our training programme, designed by industry experts, enables participants to quickly acquire proficiency in business analytics

The Business Analyst course covers diverse topics such as Business Analytics with Python, Tableau, and R-Programming, empowering learners to forecast customer trends, analyse behaviour, and interpret data effectively. Whether you are a fresher or a seasoned professional seeking to excel in business analytics, our course caters to your needs and enhances your analytical skills.

We welcome individuals with a graduation degree to join our high-quality Business Analyst Training Course in Delhi, tailored for those aspiring to enter the field of business analytics or enhance their proficiency in data analysis techniques. At our institution, we are dedicated to equipping individuals with the knowledge and skills required to thrive in the dynamic realm of business analytics.

CERTIFICATION

GDF Skills' Business analytics Certificate will take you on a revolutionary experience. Develop the skills necessary to flourish in the Business analytics era and establish yourself as a leader in the competitive field of Business analytics. Join us to become a certified Business analytics professional!

ELIGIBILITY:
Graduation/DBA/ Diploma/
Equivalent/10+2

COURSE FEE:
Rs 20k

COURSE PLACEMENT:

WHY TO CHOISE US:

MODULES
Module 1 - BASIC & ADVANCED EXCEL WITH DASHBOARD & EXCEL ANALYTICS
expand_more
  1. Introduction to Excel
    • Basic Understanding Menu and Toolbar, Introduction to different category of functions like Basics, Mathematical and Statistical, Date and Time, Logical, Lookup and References, Text and Information.
  2. Mathematical Functions
    • Sum, Sumif, Sumifs, Count, Counta, Countblank, Countif, Countifs, Average, Averagea, Averageif, Averageifs, Subtotal
    • Aggregate, Rand, Randbetween, Roundup, Rounddown, Round, Sumproduct
  3. Date and Time Function
    • o Date, Day, Month, Year, Edate, Eomonth, Networkdays, Workday, Weeknum, Weekday, Hour, Minute, Second, Now, Today, Time
  4. Text Functions & Data Validation
    • Char, Clean, Code, Concatenate, Find, Search, Substitute, Replace, Len, Right, Left, Mid, Lower, Upper, Proper, Text, Trim, Value, Large, Small Filters (Basic, Advanced, Conditional), Sort (Ascending, Descending, Cell/ Font Color), Conditional Formatting, Data Validation, Group & Ungroup, Data split.
  5. Statistical Function & Other Functions
    • Isna, Isblank, Iserr, Iseven, Isodd, Islogical, Isytext, Max, Min, Len, Right, Left, Mid, ,Maxa, Maxifs, Median, Minifs, Mina, Vara, Correl, Geomen
  6. Logical Functions
    • And, Or, If, Iferror, Not, Nested If
  7. Lookup & Reference Functions
    • VLookup, HLookup, Index, Match, Offset, Indirect, Address, Column, Columns, Row, Rows, Choose, Arrays Concept In Lookup Formula's, Past Special, Past link
  8. Pivot Table - MIS, Data Analysis & Visualization
    • Pivot Table- What-if Analysis, Data Table -One Variable and Two Variables, Data Analysis Using Statistics, Descriptive Statistics, ANOVA, Moving Average, Testing Hypothesis, Measuring Covariance and Correlation, Distribution, Regression, Graphs & Charts, Analysis Tool Pack, Solver, Histogram, Pareto, Water Fall, Import and Export data, Protect/Unprotect sheets/workbooks, Worksheet formatting and Print Display
  9. Data Collection Method
    • With Data Quality, Collaboration & Security Like Share Your Workbook On Share Drive With Quality
  10. Analysis Single/Multidimensional Analysis
    • Like Three Dimensional (3D) Tables, Sensitive Analysis Like Data Table, Manual What-If Analysis, Threshold Values, Goal Seek, One-Variable Data Table, Two-Variable Data Table
  11. Advanced Dashboard in Excel
    • Overview of Chart types, Chart Formatting, Active X Form Controls, Principle of great dashboard design, Selecting Correct Chart to display data, Interactive Charts with Form Controls, Combo box, Check Box, Scroll Bar and Radio Button, Interactive Dashboard with Form Controls, Form Controls for reports automation, Data Models using Power Pivot
  12. Two Live Report Development in Advanced Excel
    • (Real World Data)
Module 2 - VBA / MACROS - AUTOMATION REPORTING , USER FORM & DASHBOARD
expand_more
  1. To Define KPIs (Key performance Indicator), Customer Service Dashboards or Project Management Dashboard (Gantt Chart)
  2. Dashboard Reports Based on Tables and Number or Charts/Graphs or Both.
  3. Introduction to Programming Introduction to logical thinking flowcharts & algorithms
  4. Define Objective, Start & End Points; Identifying Solution & Breaking it Into Sequential Steps Writing a Algorithm
  5. Step-by-Step Instructions, Flowcharts, Process Flow Diagrams. Excel Macros - an Introduction
  6. Complete Review of the VBA Language (Subs, Functions, Variables, Arrays, Loops, Logic. etc.)
    • Excel Macro Language Review (VBA) Including Variables, Data Types, Constants, Arrays, Operators, Expressions, Loops, Logic Decisions And Calling
    • Overview Of Commanding Excel Using VBA Including A Discussion Of Objects, Properties And Methods
    • The Power of Macros - What, When, How to use Macros.
    • Introduction to Object Oriented Programming
    • Objects, Its Functions, Methods and Properties Introduction to Events
    • Details of Events, How & When to use of Events, Preparing to 'Macro' Visual Basic Editor (VBE) - Developer Tab, Security
    • Introduction to the VBE, Properties window, Project Explorer, Password Protection of Code How to use the VBE - Features, Options, Intelligence Technology
    • Debugging Mode, Bookmarks, Breakpoints, Watch Window, Immediate Window and Locals Window Inbuilt VBE Help Feature - Tips and Tricks
    • Form Controls vs. ActiveX Controls Getting into the Code
    • Message Box and Input Box Working with Data in Excel through VBA
    • Data Types, Constants and Variables
    • Different type of data type; How and When to use Variables to Store Information.
    • For-Next, For-Each, Do-While, Do until, Do Loop Decision-Making and Code Branching
    • If-Then-Else, Select-Case, And/or Nested Conditions
    • What is user's Defined Functions?
    • How to create & use them.
    • Use of Arrays in VBA programming with one dimensional, two dimensional or multi-dimensional analysis
  7. Excel VBA Power Programming For VBA Macros
    • Working with Dynamic Ranges. Protecting Worksheets, Cells and Ranges. Working with Multiple Files. Opening & Saving Files
    • How to Analyze Data On Multi Worksheets And Build Summary Sheets
    • How to Access The Windows File And Folder System To Open And Close Workbooks
    • How to Protect Your Code Against Errors
    • How to Use Excel And VBA To Create Basic Dash Boards
    • How to Create Your Own Custom Business Worksheet Functions In VBA
    • How to Create Basic Report Generation Tools Using Excel VBA, Microsoft Word And PowerPoint
    • How to Use The Excel Visual Basic Macro Recorder To Record Excel Tasks In VBA And Then Interpret The Code
  8. Overview of Using User forms To Create Business Wizards
    • Working with User Forms & User Forms Events like List box, Combo box, Option Buttons, Check box, Text box, Labels, Command button, Toggle button.
    • How to create dynamic dashboard on user form with different controls
    • How to link various user form with each other to create a complete interface between user and system
  9. Connection between Excel VBA & other platforms
    • How to Establish Connection Between VBA and Internet Explorer to Open any Internet Website through VBA
    • How to Establish Connection Between Excel VBA and power presentation to create power point through VBA
    • How to Establish Connection Between Excel VBA and Access database to update the data in access through VBA
    • How to Establish Connection Between Excel VBA and outlooks through VBA
    • How to Establish Connection Between Excel VBA and MS Word through VBA
  10. Testing and Debugging Your Code
    • Types of Errors
    • Using Breakpoints
    • Debugging Techniques
    • Dialogue Boxes
    • UsingMsgBox Function
    • UsingInputBox Function
    • Working with FileDialog
    • Working GetOpenFilname Method
    • Working GetSaveAsFilename Method
  11. Effective Error Handling
  12. Automation Development Reports & Live Projects
Module 3 - SQL & MS ACCESS- DATA MANIPULATION,QUERIES,SCRIPTS & SERVER CONNECTION- MIS & DATA ANALYTICS
expand_more
  1. Introduction to SQL
    • SQL Course overview
    • Installing the test environment
    • What is SQL?
    • Editors and Platforms to learn SQL
  2. Complete SQL in a Class
    • Quick-start introduction
    • Using the basic SELECT statement
    • Selecting rows
    • Selecting columns
    • Counting rows
    • Inserting data
    • Updating data
    • Deleting data
    • Import and Export data
  3. Fundamentals of SQL
    • Databases and tables
    • SQL syntax overview
    • Data Definition, Data Manipulation, Data Control, Transactional Control statements
    • Creating tables
    • Deleting a table
    • Inserting rows into a table
    • Deleting rows from a table
    • What is NULL?
    • Controlling column behaviors with constraints
    • Changing a schema with ALTER
    • Filtering data with WHERE, LIKE, and IN
    • Removing duplicates with SELECT DISTINCT
    • Sorting with ORDER BY
  4. How Relationships Work in SQL
    • Understanding joins
    • Accessing related tables with JOIN
    • Multiple related tables
  5. Explaining SQL Strings
    • About SQL strings
    • Finding the length of a string
    • Selecting part of a string
    • Removing spaces with TRIM
    • Making strings uppercase and lowercase
  6. Numbers and SQL
    • About numeric types
    • Finding the type of a value
    • Integer division and remainders
    • Rounding numbers
  7. SQL Functions and Clause
    • The Aggregate functions MIN, MAX, AVG, SUM and COUNT, UPPER, LENGTH, LOWER
    • The GROUP BY and HAVING clauses Grouping in a combination with joining
  8. Triggers in SQL
    • Concept of Trigger
    • Create Trigger for (Insert,Update,Delete)
    • Alter Trigger
  9. What are Subselects and Views in SQL
    • Creating a simple subselect
    • Searching within a result set
    • Creating a view
    • Creating a joined view
  10. Maintaining SQL Server Database
    • Backup Database
    • Restore Database
  11. SQL Server Job Creation
    • How to create job in SQL Server Agent
    • How to schedule job
  12. Access environment and tools
  13. Database terminology and concept
  14. Designing database in Access
    • Join Tables That Have No Common Fields
    • Work with Subdatasheets
    • Create Sub queries
  15. Working with the runtime of Tables
  16. Data migration and importing
  17. Working with the Design side of Queries
  18. Working with the runtime of Queries
  19. Working with the Design side of Forms
    • Adding Controls to Forms
    • Creating Sub forms
    • Organizing Information with Tab Pages
    • Displaying a Summary of Data in a Form
    • Applying Conditional Formatting
  20. Working with the runtime of Forms, Managing Switchboard
  21. Understanding RDBMS
  22. Working with the Design side of Tables
    • Create Query
  23. Working with the Design side of Reports
    • Organize Report Information
    • Format Reports Include Charts in a Report
    • Add a Calculated Field to a Report
    • Add a Sub report to an Existing Report
  24. Working with the runtime of Reports
  25. Working with the Design side of Macros
    • Creating a Macro Restricting Records Using a Condition
    • Automating Data Entry Using a Macro
  26. Working with the runtime of Macros
  27. How to create a functional specification
  28. Build a real-world business application
  29. Putting altogether and deployment
Module 4 - TABLEAU | MS POWER BI , BI & DATA VISUALIZATION
expand_more

    Module 4 A) Tableau

    1. Getting Started with Tableau
      • Overview Of Tableau
      • Tableau Architecture
      • Installation And Configuration Of Tableau 10
    2. Connecting to The Data
      • Managing Metadata
      • Managing Extracts
      • Data Sources
      • Cross-Database Joins
      • Data Aggregation And Data Ports
      • Tableau Charts
      • Bar Charts and Stacked Bars Data Blending
      • Tree Maps and Scatter Plots
      • Individual Axes, Blended Axes, Dual Axes and Combinational Chart
    3. Visual Analytics
      • Drill Down and Hierarchies
      • Sorting, Filtering and Grouping
      • Trend and Reference Lines
      • Forecasting and Clustering
      • Analysis with Cubes and MDX
    4. Developing First Bar Char
      • Connecting Tableau to Data File
      • Navigating Tableau
      • Calculated Fields
      • Adding Colors, Labels and Formatting

    Module 4 B) MS Power BI

    1. A Quick Introduction
      • What is MSPBI and its scope
      • Learn the common work flow in MSPBI
      • Building blocks of MSPBI and its relations
      • Quick demo how to create a business dashboard in MSPBI
      • MSPBI components
      • Old vs. new technologiesnecting to The Data
      • Power BI Desktop/Service/Mobile
    2. Getting Business Data
      • Get data in shape for use with MSPBI
      • Combining two or more data sets (source data) for reporting
      • Tackling messy data in MSPBI
      • Clean and transform data
    3. Modelling in Power BI
      • How to connect many different data sources
      • Manage data source (database) relationships
      • Unique keys
      • Calculated columns and more
      • Custom calculations to evaluate time-based functions
      • Build calculated tables based on DAX formulas and expressions
      • Creating and viewing visuals easier with optimized models
      • Discover hierarchal drill-down tools for date fields
    4. Data Visualization
      • Create and customize visualization in MSPBI and its power
      • Use combination charts

    Time Series, Maps and Aggregation

    • Data Extracts and Time Series
    • Understanding Granularity, Aggregation and Level of Details
    • Default Location in Maps
    • Custom Geo Coding
    • Symbol Map and Filled Map

    First Dashboard

    • Into Section
    • Joining Data In Tableau
    • Working With Maps and Hierarchies
    • Scatter Plot and Applying Filters in Different Sheets
    • Creating First Dashboard

    Blending Data and Dual Axis Charts

    • Duplicate Values
    • Multiple Fields
    • Data Blending
    • Dual Axis Chart
    • Building Calculated Fields

    Table Calculation and Storytelling

    • Downloading Dataset and Connection
    • Mapping
    • Building Table Calculation For Gender
    • Bins and Distributions for Age
    • Tree Map Chart
    • Advanced Dashboard
    • Storyline and Storytelling

    Data Preparation

    • Data Format
    • Data Interpreter
    • Multiple Columns And Pivot
    • Metadata Grid
    • Advanced Data Preparation
    • Create and format slicers with it
    • Map visualizations and its utilization
    • Use tables and matrixes
    • Long live bubbles
    • scatter charts in action
    • Advanced funnel and waterfall charts
    • Drive fast dashboard insights with gauges and numbers
    • Color your visualization world with colors
    • shapes and scales
    • Adding personal touch
    • logo etc. to reports and dashboards
    • Display and present your dashboard in a way you want with summarize data
    • Control how your report elements overlap with each other
    • Learn to drill into hierarchies
    • Manage how levels are shared (Z-order in reports)
    • How to use R visuals in MSPBI

    Data Exploring & Sharing

    • Quick insights in Power BI Service
    • Create and configure a dashboard
    • Share dashboard with your organization
    • Display and edit visuals- tiles
    • full screen
    • Get more space on your dashboard
    • Install and configure a personal gateway
    • Excel and MSPBI
    • Import and excel table into Power BI
    • Import excel files with data models and power view sheets
    • Connect One Drive for business to MSPBI
    • Excel data in Power BI summary

    DAX (Data Analysis Expression) Application

    • DAX and its basic building blocks
    • Create calculated columns (fields) and measures in MSPBI using DAX formulas
    • Breadth of functions available in DAX
    • User variables in DAX
    • Create expressions across multiple tables with relational functions
    • Filter and evaluate tables using advanced table functions

Module 5 - PYTHON | R PROGRAMING ,BI & DATA VISUALIZATION
expand_more

    Module 5 A) R-Programming

    1. Introduction to Business Analytics
      • Introduction to Business Analytics
      • Types of Analytics
      • Case study on Walmart, Signet Bank
      • Data Science and its importance
    2. Introduction to R
      • Introduction to R
      • Installing R
      • Installing R Studio
      • Workspace Setup
      • R Packages
    3. R Programming
      • R Programming
      • if statements
      • for statements
      • while statements
      • repeat statements
      • break and next statements
      • switch statement
      • scan statement
      • Executing the commands in a File
    4. R Data Structure
      • Data structures
      • Vector
      • Matrix
      • Array
      • Data frame
      • List
      • Factors
    5. Apply Functions
      • DPLYR & apply Function
      • Import Data File
      • DPLYP - Selection
      • DPLYP - Filter
      • DPLYP - Arrange
      • DPLYP - Mutate
      • DPLYP - Summarize
    6. Apply Functions
      • Data visualization in R
      • Bar chart, Dot plot
      • Scatter plot, Pie chart
      • Histogram and Box plot
      • Heat Maps
      • World Cloud

    Module 5 B) Python

    1. Introduction to Python
      • Python Overview
      • Advantages and Disadvantages
      • Installation and Configuration
      • Interpreted Languages
    2. Programming with Python
      • Python Script
      • Standalone Scripts Under Unix And Windows
      • Using Variables and Operators
      • Command Line Parameters
      • Understanding Expressions
    3. Flow Control
      • If And Else If Statement
      • The While and Loop Statement
      • Continue Statement
      • Break Statement
      • Range () Function
      • Using Lists
    4. Sequence Data
      • List Operations and Methods
      • Sets
      • Dictionaries
      • Tuples
      • Strings
    5. Functions
      • Defining Functions
      • Parameters and Variables
      • Using Global Statement
      • Keyword Arguments
      • Keyword Only Parameters
      • The Return Statement
      • Varargs Parameters
      • Docstrings
    6. Errors and Exception Handling
      • Dealing Syntax Errors
      • Exception Handling
      • Cleaning Up
    7. Modules
      • Creating Modules
      • The From and Import Statement
    8. Apply Functions
      • Introduction to statistics
      • Type of Data
      • Distance Measures (Similarity, dissimilarity, correlation)
      • Euclidean space
      • Manhattan
      • Minkowski
      • Cosine similarity
      • Mahalanobis distance
      • Pearson’s correlation coefficient
      • Probability Distributions
    9. Hypothesis Testing I
      • Hypothesis Testing
      • Introduction
      • Hypothesis Testing – T Test, Anova
    10. Hypothesis Testing II
      • Hypothesis Testing about population
      • Chi Square Test
      • F distribution and F ratio
    11. Regression Analysis
      • Regression
      • Linear Regression Models
      • Non Linear Regression Models
    12. Classification
      • Classification
      • Decision Tree
      • Logistic Regression
      • Bayesian
      • Support Vector Machines
    13. Clustering
      • Clustering
      • K-means Clustering and Case Study
      • Logistic Regression
      • DBSCAN Clustering and Case study
      • Hierarchical Clustering
    14. Association
      • Association
      • Apriori Algorithm
      • Candidate Generation
      • Visualization on Associated Rules
      • Summary
      • Package
      • Dir Function
      • Module Name
    15. Importing and Exporting Data
      • Importing Data From Different Sources
      • Connecting To Databsem
      • Viewing Data Objects And Sets
      • Exporting Data To Other Formats
    16. Data Manipulation and Data Analysis
      • Cleansing Data With Python
      • Data Manipulation
      • Python Tools And In-Built Functions
      • Formatting And Normalizing Data
      • User Defined Functions
      • Data Analysis Using Statistics And Graphical Representation
    17. Data Structures and Regular Expressions
      • List, Tuples, Dictionaries And Set
      • Re Objects
      • Pattern Matching
      • Subexpressions
      • Parsing Data
      • Complex Substitutions
    18. Live Practice Sessions
      • Projects and Assignments
      • Live Training

Module 6 - PYTHON DATA SCIENCE & MACHINE LEARNING - 100% Free in Offer - by IIT/NIT Alumni Trainer
expand_more
  1. Introduction to Python Programming for Data Analysis
    • Data types : int, float, str etc
    • Operations on data types
    • Data structures: list, dict, tuples, set
    • Iterators/iterables
    • functions
    • Pandas Dataframe, NumPy arrays
    • Data manipulation in pandas: slicing, subset, cross tabulation, aggregation

    Reference Data for running example

    • XYZ Company Dataset
    • Titanic

Module 6 A) Data Exploration

  1. Data Exploration
    • Univariate Statistics: mean, median, std.
    • Bivariate Statistics : correlation , covariance
    • Plots using Matplotlib,seaborn
    • Concepts of inferential statistics
    • Standardization
    • log transform
    • dummy variable creation
  2. Dimensionality Reduction + Linear Transformation
    • PCA
    • LDA
    • Matrix
    • Determinant
    • Matrix multiplication
    • Element wise operations

Module 6 B) Supervised Learning

  1. Supervised Learning
    • Linear classifier: logistic regression
    • Linear classifier: Support Vector Classifier
    • Tree Classifier: Decision Trees
    • Ensemble Classifier: RF, Boosted Trees
    • Cost Function minimization
    • Scikit learn library
    • Regression
  2. Machine Learning Concepts
    • Bias , Variance
    • Regularization
    • Hyperparameter tuning
    • Parametric / non parametric methods
    • cross validation
    • Sampling data

Module 6 C) Advanced Unsupervised Learning

  1. Advanced Unsupervised Learning
    • K means Clustering
    • t- SNE
    • Agglomerative Clustering

Module 6 D) Introduction to Text processing

  1. Introduction to Text processing
    • Tokenization
    • N-grams
    • TF-IDF
    • cosine similarity
    • Text Classification
    • Topic Modelling
    • spaCy library

Module 6 E) Introduction to Deep Learning

  1. Introduction to Deep Learning
    • Understanding a perceptron
    • Forward propagation
    • Backward propagation
    • Parameter update
    • CNN
    • RNN: GRU, LSTM
    • Regularization: dropout, data augmentation
    • Optimization: Momentum, Adam, AdamW
      • Data loading
      • gradient descent
      • Framework
    • PyTorch
Document

HOW TO APPLY

1

REGISTRATION

Begin your adventure with GDF Skills by registering in person at a branch. Fill out the offline form to get your admission. This step establishes your presence on the platform and sets the stage for your skill development.

2

DOCUMENTATION

Complete the paperwork procedure after registering. This might include giving extra information, validating your identification, or submitting academic and professional credentials. GDF Skills provides a safe and efficient documentation method to validate your profile.

3

GET STARTED NOW

You can begin after your documentation is accepted. Explore GDF Skills' extensive range of courses and select those that are relevant to your objectives. Make any required fees and obtain access to the learning materials, resources, and tools required for your chosen courses.

Related Courses

JAVA
PHP
IT-EXPERT
BLOG

You're a beginner or have little bit knowledge of web designing and want to set a career in Web Designing, then you should learn from the beginning. In our complete web designing course, we will train you with all the knowledge of web designing and teach you on all the latest web-based technologies. This course will enable you to make your own web site in a single day. We bring students through a live environment in which you get an opportunity to work on live web sites as per to your skill sets. We will teach you how to create a web site as well as how to make it appear on google. We guarantee you an edge over others. The Advanced Website designing certification course is totally practical web design training that includes all the prerequisites of responsive web design on the basis of latest market demands and trends. This course is one of the professional practical courses offered by Arth, a top web designing organization. Arth is very good in its student’s placement by its 100% placement help policy. There are many companies tied up with Arth; all companies are good and trending in IT field. We offer best than best placement assistance to our students for his/her brighten future. To know more information about Arth’s placement Assistance, you can visit here.

1 COMMENT

JASON ANDERSON

DECEMBER 14 , 2022

Lorem ipsum dolor sit amet, consectetur adipiscing elit. In et ipsum sit amet ex pulvinar mattis. Pellentesque vitae purus viverra, aliquet lacus in, fringilla massa. Suspendisse ac est a nisi aliquet sollicitudin. Interdum et malesuada fames.


LEAVE A COMMENT

Document